 Metadata Catalogue
National Institute of Water and Atmospheric Research (NIWA)
Type of resources
Topics
Keywords
Contact for the resource
Provided by
Years
Update frequencies
status
-

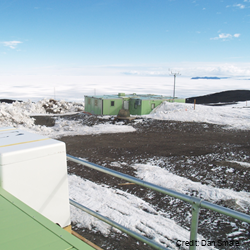
Climate data have been collected at Scott Base continuously since 1957 and more recently from Arrival Heights and is one of the longest continuous climate records in Antarctica. Climate parameters measured include: wind speed and direction, air temperature, relative humidity, barometric pressure, and global, diffuse and direct solar radiation. Climate data are collected on a daily basis from both sites. At Scott Base, this takes two forms: a standard daily observation at 0900 NZDT, and continuous data collection at 10 minute and hourly intervals using a CR10X data logger. The initial record of the 0900 daily observations began on 1 March 1957 with air temperature, air pressure, wind speed and direction, and global solar radiation being measured with standard instrumentation (wind measurements since 1972). This record constitutes the reference record. In January 1997 an electronic weather station (EWS) was added to collect and archive 10 minute and hourly data. The daily manual observations continued so as to provide a continuous reference and daily record. Historically, Arrival Heights only had a wind recorder (since January 1984). A data logger was installed in January 1999 and measured air temperature, relative humidity and global solar radiation using a secondary network sensor, as well as wind speed and direction. A barometric pressure sensor was installed in 2001. A standard 10m mast was installed and all sensors were moved to the new Arrival Heights laboratory in 2007. 10-minute and hourly data are recorded. Data are retrieved and archived from both automatic stations daily, as well as manual observations from Scott Base and available on New Zealand's national climate database. From February 2019, mercury theremometers and barometers were removed from Scott Base and Arrival Heights. Where applicable, these were replaced with electronic instruments. A weighing precipitation gauge was also installed in February 2019 for the measurement of solid precipitation at Scott Base. GET DATA: https://cliflo.niwa.co.nz/
-
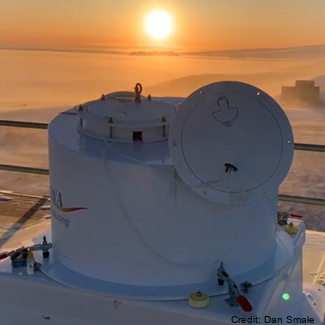
Ultraviolet radiation measurements over the spectral region 290-450 nm with a high precision spectro-radiometer. The spectro-radiometer was installed at Arrival Heights as a two month (November 2006 – January 2007) blind inter-comparison with the established measurement programme run by Biospherical Instruments for the USAP. The data was compared with the USAP data taken simultaneously. These data are held internally by NIWA. GET DATA: contact dan.smale@niwa.co.nz
-
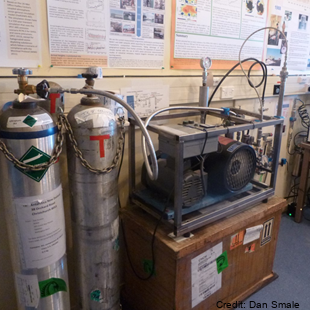
Gas samples (CO2, CH4, CO, N2O, 13CO2, 14CH4, 13CO, C18O, 14CO) are collected from an inlet atop of a mast 5 metres above ground level in North sector wind conditions. Flasks and cylinders are analysed back at NIWA Greta point Gaslab. The sampling was established in November 1989. Samples are only taken when wind is from the Northerly sector and above 5kts. High pressure cylinders: ~1600psi in 30 litre cylinders and low-pressure flask samples taken (~5 litres, 25 psi in 2 litre flask). Air samples in the Cylinders & Flasks shipped to New Zealand regularly. Analysis performed at NIWA's GASLAB located at Greta Point Wellington. Analysis by Gas chromatography (GC) and isotope ratio mass spectrometry (IRMS). A semi-automated flask sampling system was installed in February 2017, allowing extra flask samples with minimal operator intervention. GET DATA: Contact Gordon Brailsford (g.brailsford@niwa.co.nz)
-
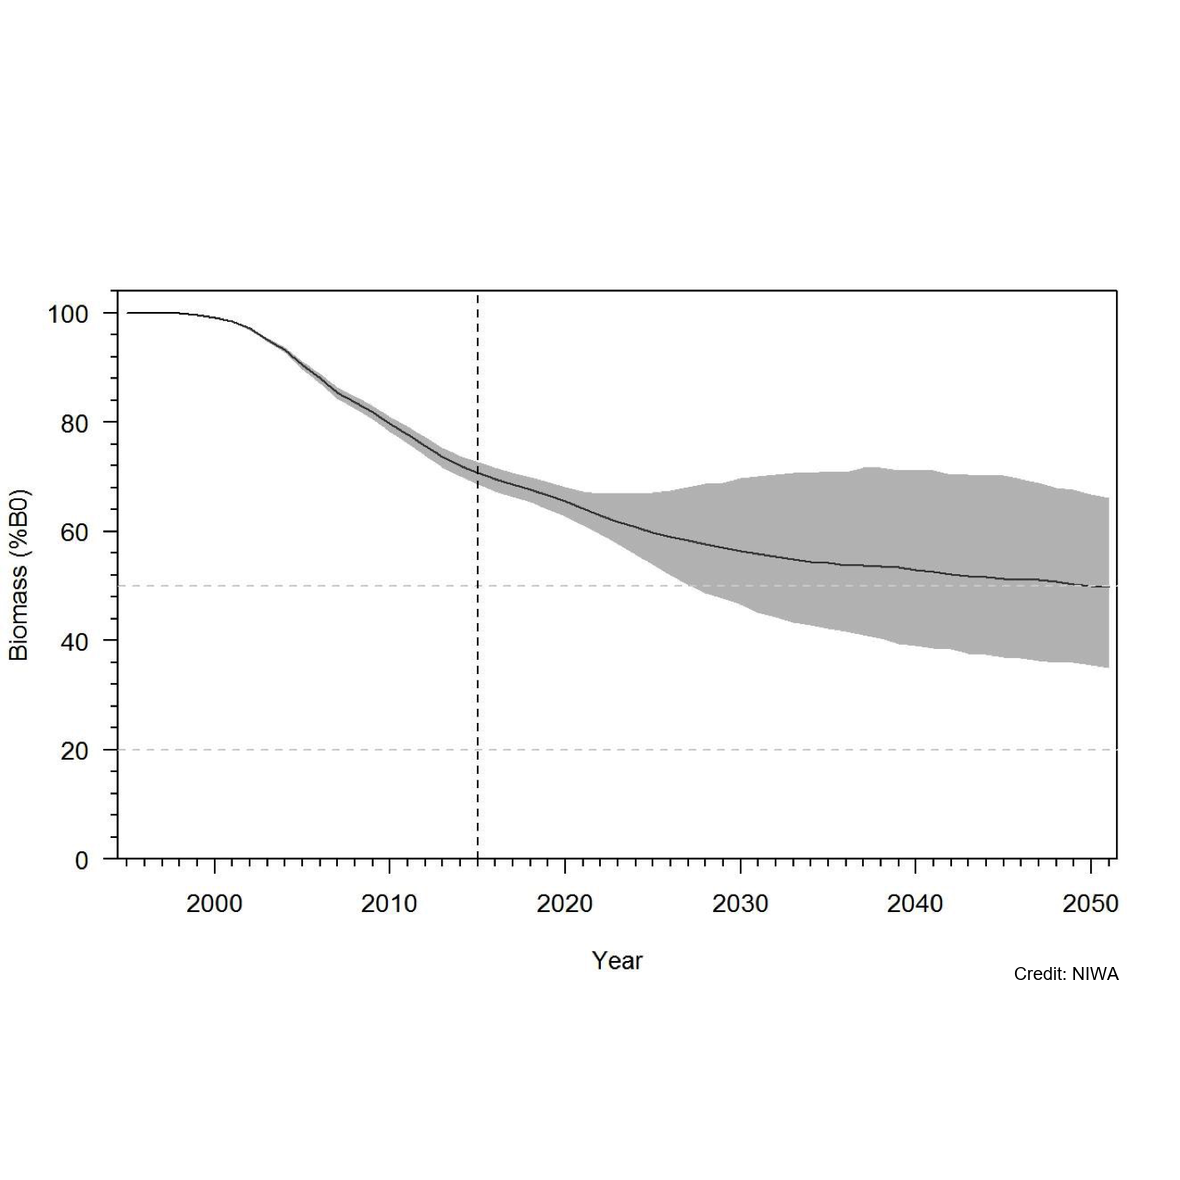
Knowledge of recruitment dynamics, and in particular trends in recruitment and recruitment variability, are key inputs for integrated assessments of fish stocks. A quantitative longline survey monitoring the recruitment of Antarctic toothfish (Dissotichus mawsoni) in the southern Ross Sea was started in 2012. The survey was expanded in 2016 to monitor trends and biological characteristics in two areas of importance to predators, Terra Nova Bay and McMurdo Sound, and to collect data that would contribute to the research and monitoring plan for the Ross Sea region Marine Protected Area. In most years, the survey was completed as planned, while in three years several factors have constrained the survey from sampling all stations and in the latest two seasons pandemic travel restrictions have necessitated an alternative delivery approach. Between 2012 and 2022, 2 056 tagged Antarctic toothfish have been released on the survey and 21 toothfish have been recaptured. Fifteen pop-up satellite archival tags (PSATs) were deployed on D. mawsoni in 2019 and fifteen skates were tagged in 2020 and 2021. Many tagged toothfish released from the RSSS move from the shelf to the slope. Trends in abundance indices and size and age composition consistently show the progression of strong year classes entering and leaving the survey area and have indicated that recruitment is likely more variable than previously thought. Data from the RSSS have been used to indicate year class strength in Antarctic toothfish stock assessments since 2015. The twelve surveys to date have resulted in a substantive increase in the knowledge and understanding of the distribution and relative abundance of a range of demersal fish species and invertebrate taxa caught on the longlines. Other data routinely collected on the surveys were plankton, temperature, salinity, air quality, cetacean and other marine mammal observations, and photo, video, and echosounder data. The RSSS has provided synergies with other research programmes also addressing CCAMLR objectives, particularly those focused on research and monitoring within the RSrMPA. GET DATA: https://www.ccamlr.org/en/publications/statistical-bulletin
-
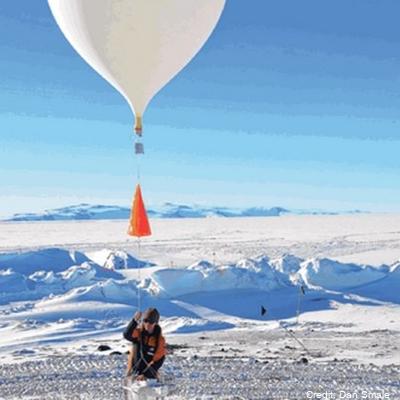
Altitude profile measurements of water vapour, ozone and aerosols using balloon packages flown through the troposphere into the stratosphere as part of the Ross Island GRUAN site activities. Maximum altitude recorded was 29 km. This project is a collaboration between the National Institute of Water and Atmospheric Research (NIWA) and NOAA. Timeline: - November 2022: 2 flights - February 2023: 1 flight - October 2023: 3 flights Data are held internally at NIWA and NOAA, and will be stored in the GRUAN database (https://www.gruan.org/data) GET_DATA: https://www.gruan.org/data
-
Measurements of partial and total column of several atmospheric trace gases (e.g.O3, HCl, N2O, CH4, HNO3, ClONO2, HCN, HF, OCS, CO, C2H6, CFC-11, CFC-12, COF2 + others). Measurements are made with Bruker Fourier transform spectrometers, using direct sunlight (or moonlight) at infrared wavelengths (700-10000cm-1). The Bruker FTS instruments have two liquid nitrogen cooled detectors (inSb & HgCdTe) and six optical filters. For 2014-2016 seasons, operated in parallel with Bruker 120M for intercomparison studies. Bruker 120M will then be retried. Bruker 125HR will replace it. Data are routinely analysed for HNO3, HCl, CH4, N2O, CO, ClONO2, HF, C2H6, HCN, and 10+ other species measurable. Information on other trace gases is contained in the spectra, not yet analysed/retrieved. “Raw” data are times and recorded interferograms which are Fourier transformed into spectra. “Derived” data are column amounts, and in some cases limited vertical profile information, of atmospheric trace gases. Technique for vertical profile information uses "optimal estimation" to extract information from pressure broadening of absorption lines: SFIT2/SFIT4. The original solar tracker was replaced with a newer tracker in December 2017, active tracking of sun now possible. A Bruker EM27-Sun operated for a summer season at AHTS, to access capability. Measurements of total column CO2, CH4 and CO. Data archived as part of the COCCON network. Instrument timeline: - Bomen DA2 FTS 1990-1994 (HNO3 and HCl only) - Bruker 120M: 1996-2016 - Bruker 125HR: 2015 – present - EM27-Sun: Campaign based low resolution instrument (CO2, CH4 and CO only). February 2016 and then November 2020 – February 2021 GET DATA: https://www-air.larc.nasa.gov/missions/ndacc/data.html?station=arrival.heights GET DATA (EM27-Sun): https://www.imk-asf.kit.edu/english/COCCON.php
-

In collaboration between Korea Polar Research Institute and NIWA, an oceanographic mooring was deployed to the North of the Drygalski Ice Tongue (-75.360083, lon:164.748633) on 3 March 2018 as a part of the ANA08C research cruise, and it was recovered on 4 January 2019. To monitor physical properties (Temperature, Salinity, Current) of ocean water in the north of the Drygalski Ice Tongue. GET DATA: https://kpdc.kopri.re.kr/search/90416713-7e1f-4c4d-a0b6-46c8deeea43e
-
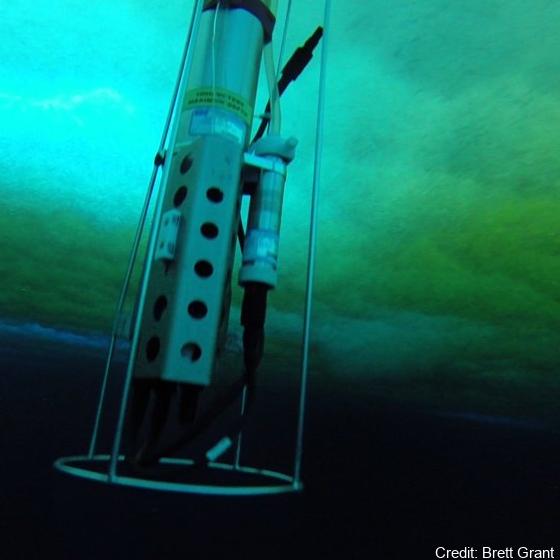
Data from a measurement campaign examining the oceanic connection between an ice shelf cavity and sea ice. Here we present data from the ocean boundary-layer in an Ice Shelf Water outflow region from the Ross/McMurdo Ice Shelves. From a fast ice field camp during the Spring of 2015, we captured the kinematics of free-floating relatively large (in some cases 10s of mm in scale) ice crystals that were advecting and then settling upwards in a depositional layer on the sea ice underside (SIPL, sub-ice platelet layer). Simultaneously, we measured the background oceanic temperature, salinity, currents and turbulence structure. At the camp location the total water depth was 536 m, with the uppermost 50 m of the water column being in-situ super-cooled. Tidal flow speeds had an amplitude of around 0.1 m s-1 with dissipation rates in the under-ice boundary layer measured to be up to e=10-6 W kg-1. Acoustic sampling (200 kHz) identified backscatter from large, individually identifiable suspended crystals associated with crystal sizes larger than normally described as frazil. Crystal sizes in the SIPL were also measured. RELATED PUBLICATION: https://doi.org/10.3389/fmars.2023.1103740 GET DATA: https://doi.org/10.17882/90432
-
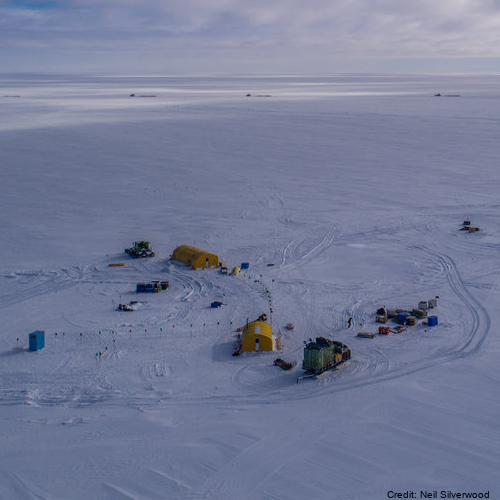
Here we provide data from the Ross Ice Shelf ocean cavity. The HWD2 Camp was established in October of 2017 at (-80 39.497, 174 27.678) where the ice is moving seaward at around ~600 m a-1 and is sourced from the Transantarctic Mountains. Profiling Instruments - Profiling was primarily conducted with an RBR Concerto CTD (conductivity-temperature depth) profiling instrument, and this was cross-calibrated against irregular profiles with an RBR Duet (pressure and temperature only), a SBE37 MicroCat CTD as well as moored SBE37 MicroCat CTDs. The RBR unit is small and has suitable sensor capability (temperature and conductivity accuracies of ±0.002°C and ±0.003 mS cm-1). Its conductivity cell design is not prone to fouling by ice crystals, making it ideal for work in the sometimes crystal-laden borehole conditions. We were inconsistent in how we mounted the CTD on its protective frame and this appeared to make small difference in the conductivity signal (resulting in an ~0.03 psu variation). This was post-corrected based on the essentially invariant mooring data from the lower water column as well as SBE37 cross-calibration profile data. Because of the potential for sediment contamination of the sensors, the profiles were mostly conservative in their proximity to the sea floor. On several occasions, profiles were conducted all the way to the sea floor. The temperature and salinity are presented in EOS-80 in order to compare with available data. Eighty-three profiles are provided here (ctd_HWD2_*.dat). In addition, limited microstructure profiling was conducted to provide insight into some of the mixing details. The profiles were conducted by lowering the instrument to the ice base then commencing a sequence of three up-down “yo-yos” before returning to the surface and downloading. A data segment is included here (VMP_HWD2.dat). There were some challenges registering the vertical coordinate for the profiles. The melting of the borehole generates a trapped pool of relatively fresh water. The interface between this and the ocean should be near the base of the hole or a little higher – with seawater intrusion. However, there were some instances where the interface was at a higher pressure (i.e. apparently in the open water column). The best explanation for this is that the water in the borehole is not at static equilibrium for some period after initial melting. We use 34.3 psu as a cut-off, in addition to a pressure criterion to identify the top of the useful oceanic profile. It is also not inconceivable that water was being ejected from the hole, but it is unlikely that this would have impacted in the consistent observed pattern. Instrumented Mooring - The mooring instruments at HWD2-A comprised 5 Nortek Aquadopp single point current meters in titanium housings reporting to the surface (30-minute interval, Table SI-Three) via an inductive modem to a Sound-9 data logger and Iridium transmitter. The current meter measurements were corrected to account for the 138° magnetic declination offset (i.e. the south magnetic pole is to the north-west of the field site). Five files are provided here (HWD2_Init_rcm*.dat4). Stevens Craig, Hulbe Christina, Brewer Mike, Stewart Craig, Robinson Natalie, Ohneiser Christian, Jendersie Stefan (2020). Ocean mixing and heat transport processes observed under the Ross Ice Shelf control its basal melting. Proceedings of the National Academy of Sciences, 117 (29), 16799-16804. https://doi.org/10.1073/pnas.1910760117
-
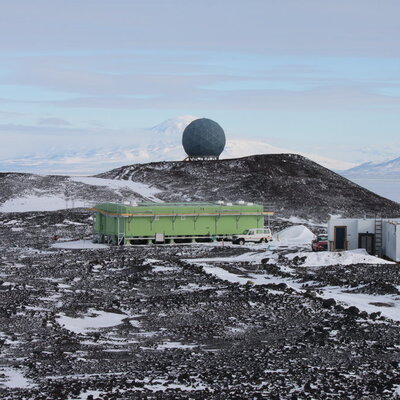
Measurements of total column of ozone made with Dobson spectrophotometer that measures either direct or zenith scattered ultraviolet light. The instrument was established in September of 1989 at 77° 49.8'S, 166° 39.6'E. Additionally a Brewer spectrophotometer took total column ozone measurements at Scott from 1989 to 1996. From 1989 to 2006 the Dobson (ID 17) was operated in manual mode but had an electronic encoder and computer added in 2006 for recording measurements. The data acquisition system was upgraded in Febuerary 2015 at Lauder, NZ. It is now running the JMA automation system. The Dobson (instrument ID: D17) is shipped out for maintenance and intercomparison with regional standard Dobson in Melbourne approximately every 5 years. Data (for both Dobson and Brewer) is held internally by NIWA and in the NDACC database. Data is also archived in the ozone and UV data centre Toronto, “Raw” data are times and instrument settings for instrument readings. “Derived” data are column amounts of ozone. Time line: Dobson 1987 -present Brewer 1989-1996 GET DATA: https://www-air.larc.nasa.gov/missions/ndacc/data.html?station=arrival.heights#